Every Pine Script developer hits the same wall sooner or later.
You have data that isn't a price feed. A sentiment score you compute every night. A spreadsheet of COT positioning. The Fed funds rate. Your own trade log. You want it on the chart, under or on the candles, lined up bar by bar with price.
And Pine says no. Scripts read the symbols the platform gives them, and nothing else. So you end up screenshotting a spreadsheet next to the chart, or hard-coding numbers into arrays and updating them by hand every week.
TradeUniv charts run Pine Script in the browser, with a full Script Editor, community indicators and your own saved scripts. On top of the language you already know, we added the one thing developers have been asking for: request.seed reads external CSV and JSON data straight into your script. One line, no server, no API key.
One File, Two Countries, Two Lines
Here's a public JSON file on GitHub with daily COVID case counts for 201 countries. Two lines of Pine pull two of them onto the chart:
//@version=6
indicator("COVID total cases: Germany vs Italy (GitHub JSON)")
de = request.seed("url", "https://raw.githubusercontent.com/pomber/covid19/master/docs/timeseries.json#rows=Germany&time=date&value=confirmed", close)
it = request.seed("url", "https://raw.githubusercontent.com/pomber/covid19/master/docs/timeseries.json#rows=Italy&time=date&value=confirmed", close)
plot(fixnan(de), "Germany", color.orange, 2)
plot(fixnan(it), "Italy", color.teal, 2)
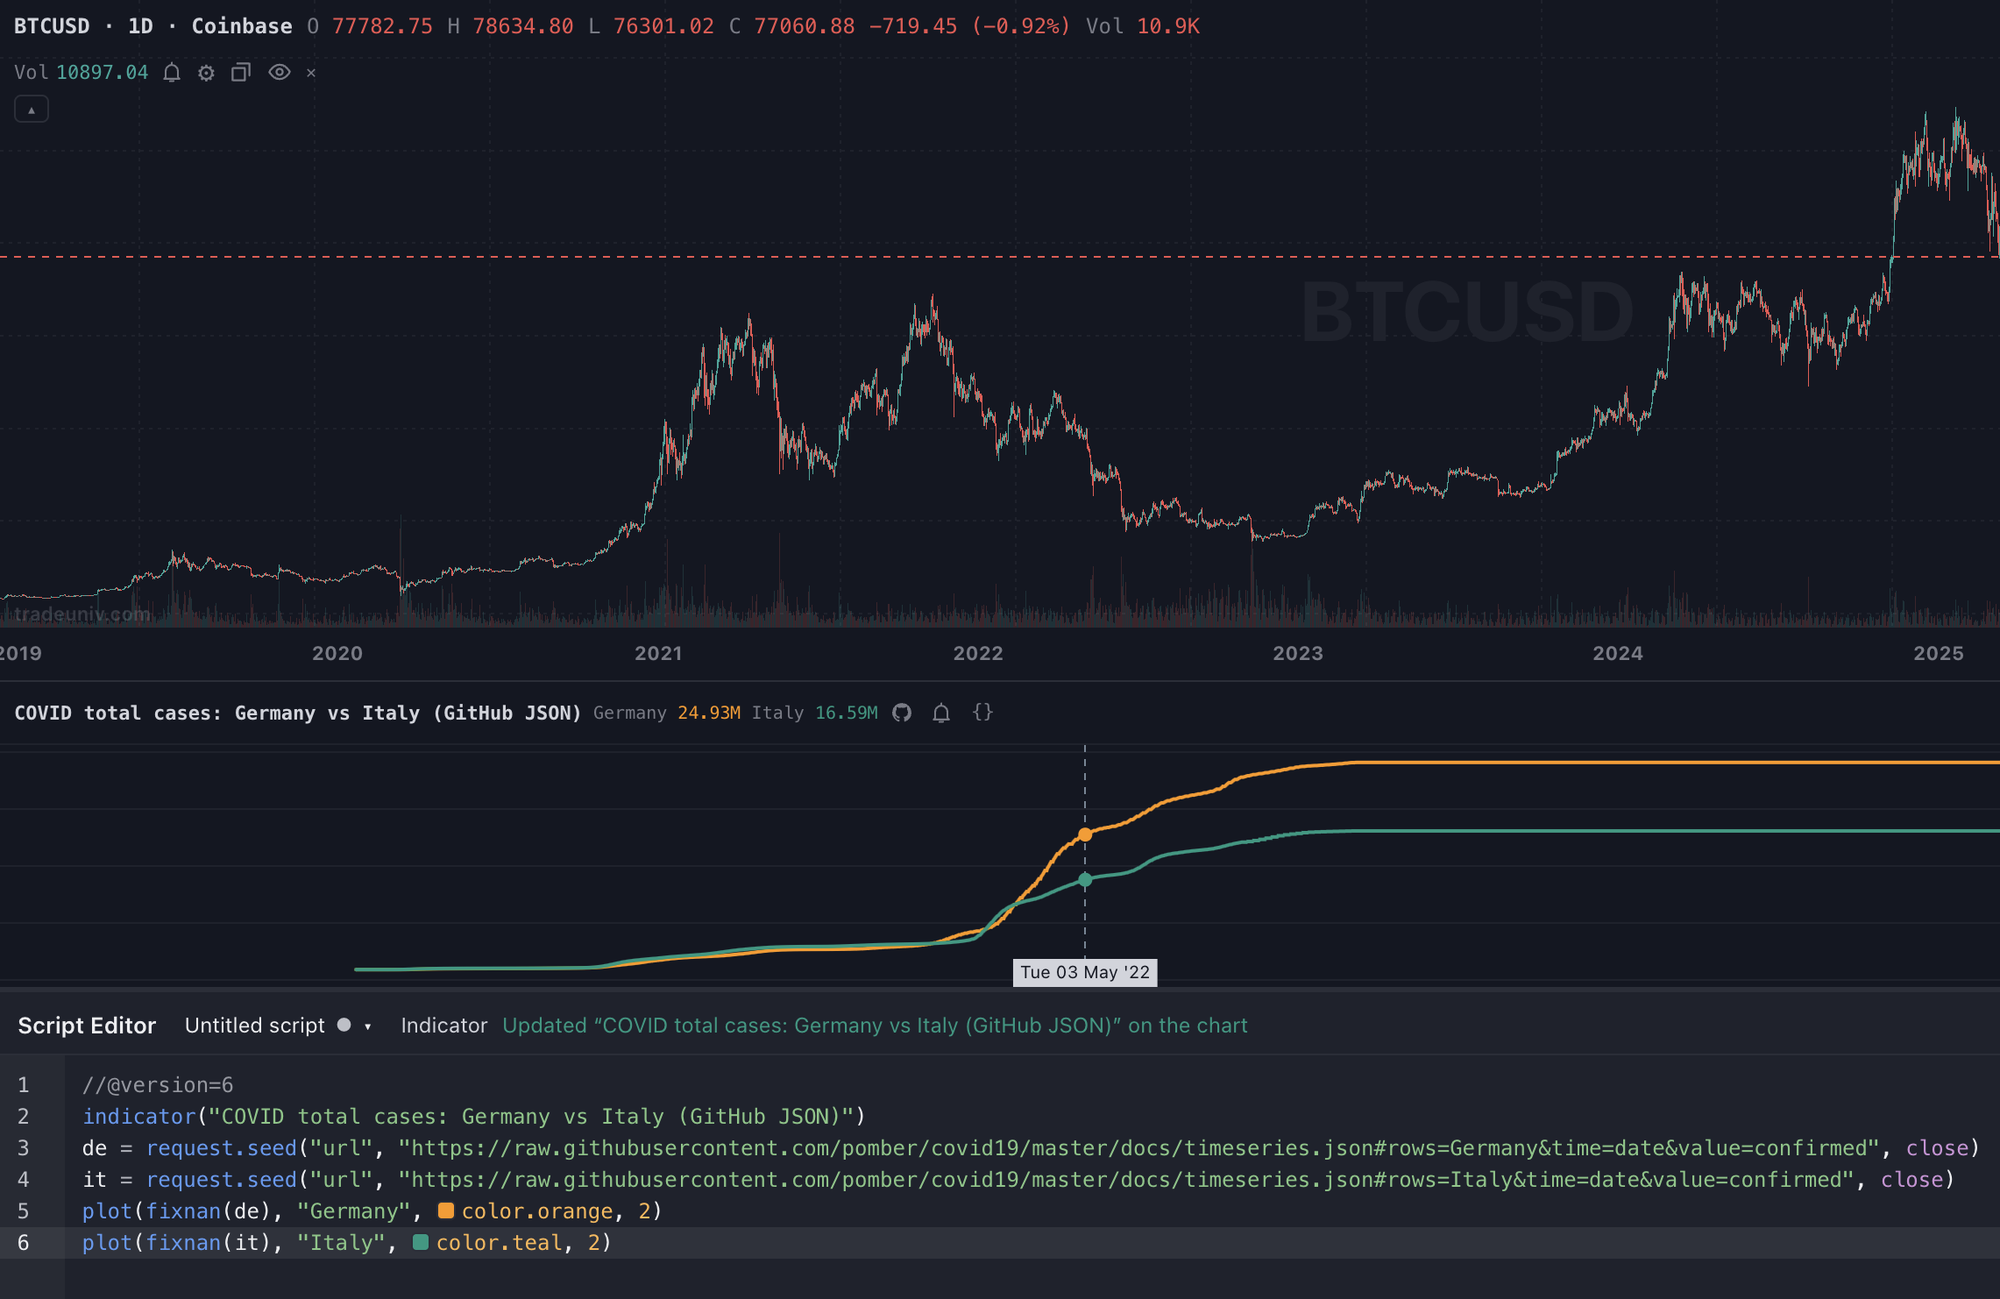
That's the whole indicator. The file is 25 MB, and the chart downloads it once for both lines. Hover the pane and you get each country's count on that day, like any other indicator.
The signature is the one you already know:
request.seed(source, symbol, expression)
sourceis where the data comes from:"url","dbnomics"or"cot".symbolis what to read: a URL, a series id or a contract.expressionis what to return, usuallyclose.
The result is a normal Pine series. Feed it into ta.sma, compare it against price, trigger alerts on it, anything you'd do with close.
Where You Can Read From
request.seed("url", ...) reads from a whitelist of hosts. That keeps any script from making your members' browsers call random servers, while still covering the places real data lives. The same list applies to your own scripts and to scripts published for everyone.
GitHub:
raw.githubusercontent.com(any public repository)gist.githubusercontent.com(any public gist)
Put a CSV or JSON in a repo or a gist, and your script can read it. Push a new version of the file, and every chart running the script picks it up. Publish the script, and everyone who adds it sees your data too.
Since anyone can put a file on GitHub, a script that reads one carries a small GitHub mark in its legend. Hover it and the chart says the data comes from an external GitHub file, so members always know which numbers come from the script's author rather than a market feed.

Public institutions:
- CFTC (
publicreporting.cftc.gov) - Federal Reserve Bank of New York (
markets.newyorkfed.org) - U.S. Bureau of Labor Statistics (
api.bls.gov) - European Central Bank (
data-api.ecb.europa.eu) - OECD (
sdmx.oecd.org) - IMF (
api.imf.org)
Only https is accepted. Files can be up to 25 MB. Your own server isn't on the list, but a GitHub repo or gist does the same job: publish the file there and point the script at it.
JSON: Pick the Field You Want
Real-world JSON is rarely a neat list of dates and values. So you describe its shape after a # at the end of the URL. That part never gets sent to the server; it tells the chart how to read the file.
rows: the path to the array of rows, likedata.seriesorResults.series.0.datatime: the field that holds the datevalue: the field (or nested path, likestats.close) that holds the number
In the COVID file, the top level is an object with one key per country, and each country holds rows like {"date": "2020-1-22", "confirmed": 0, "deaths": 0, "recovered": 0}. So rows=Germany picks the country, time=date the date and value=confirmed the column. Swap Germany for Poland, France or any of the other countries.
And because the result is a normal Pine series, you can keep working with it. Daily new cases from the running total, smoothed over a week:
//@version=6
indicator("COVID new cases, US (GitHub JSON)")
total = request.seed("url", "https://raw.githubusercontent.com/pomber/covid19/master/docs/timeseries.json#rows=US&time=date&value=confirmed", close)
daily = ta.change(fixnan(total))
plot(ta.sma(daily, 7), "New cases, 7-day avg", color.orange, 2)
plot(daily, "New cases", color.new(color.orange, 70), style = plot.style_columns)
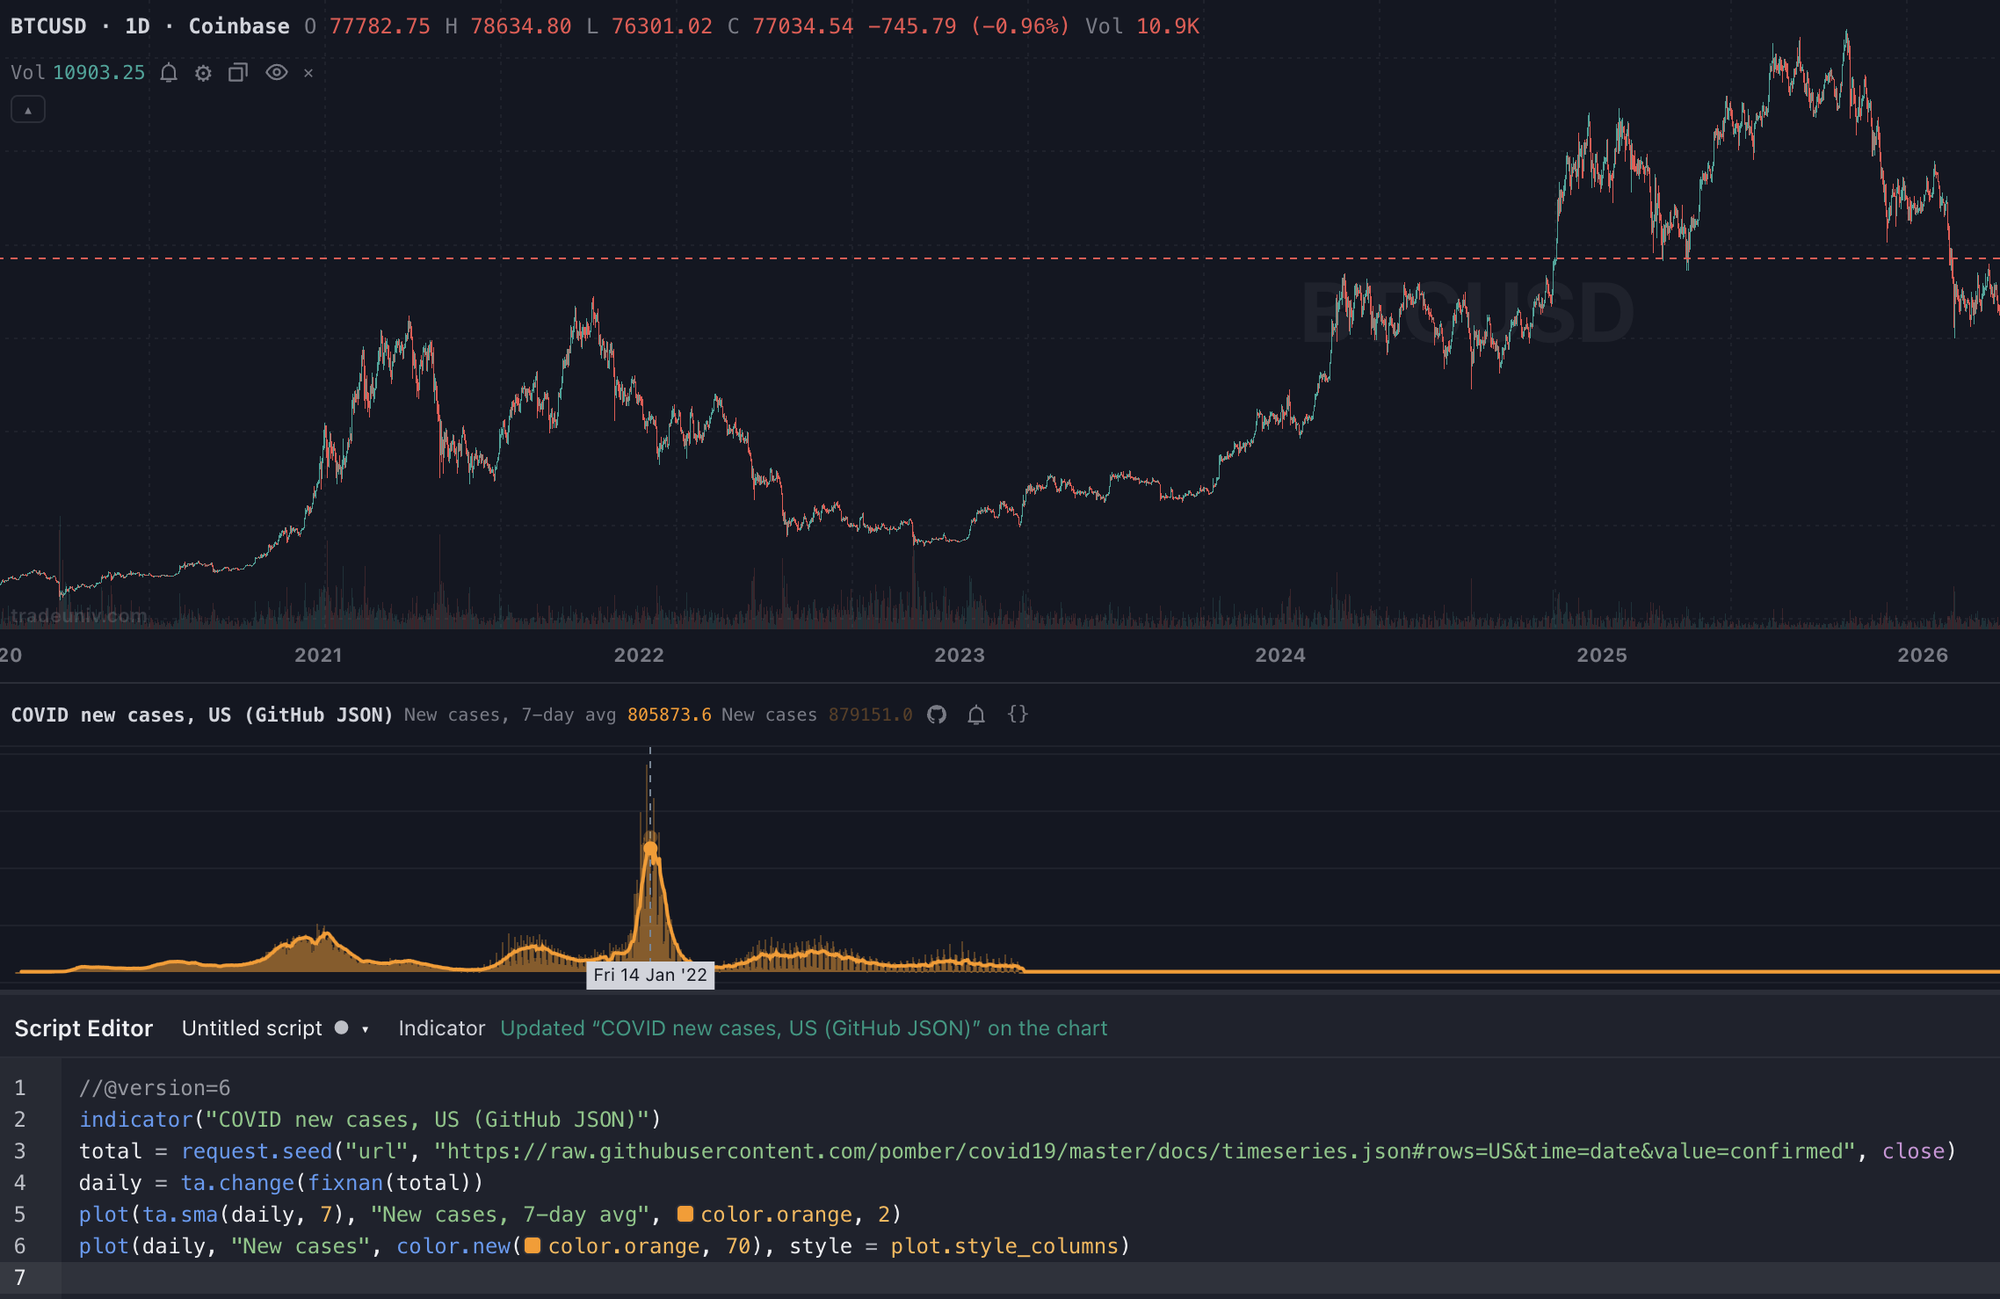
If your JSON uses common field names (date, time, timestamp for the date; value, close, price, rate for the number), you can skip the options entirely. Rows written as arrays work too: [date, value] or [date, open, high, low, close].
CSV: Name the Column
A plain date,value or date,open,high,low,close,volume file works as is. Daily Brent crude since 1987, from a public GitHub CSV:
//@version=6
indicator("Brent crude (GitHub CSV)")
brent = request.seed("url", "https://raw.githubusercontent.com/datasets/oil-prices/main/data/brent-daily.csv", close)
plot(fixnan(brent), "Brent")
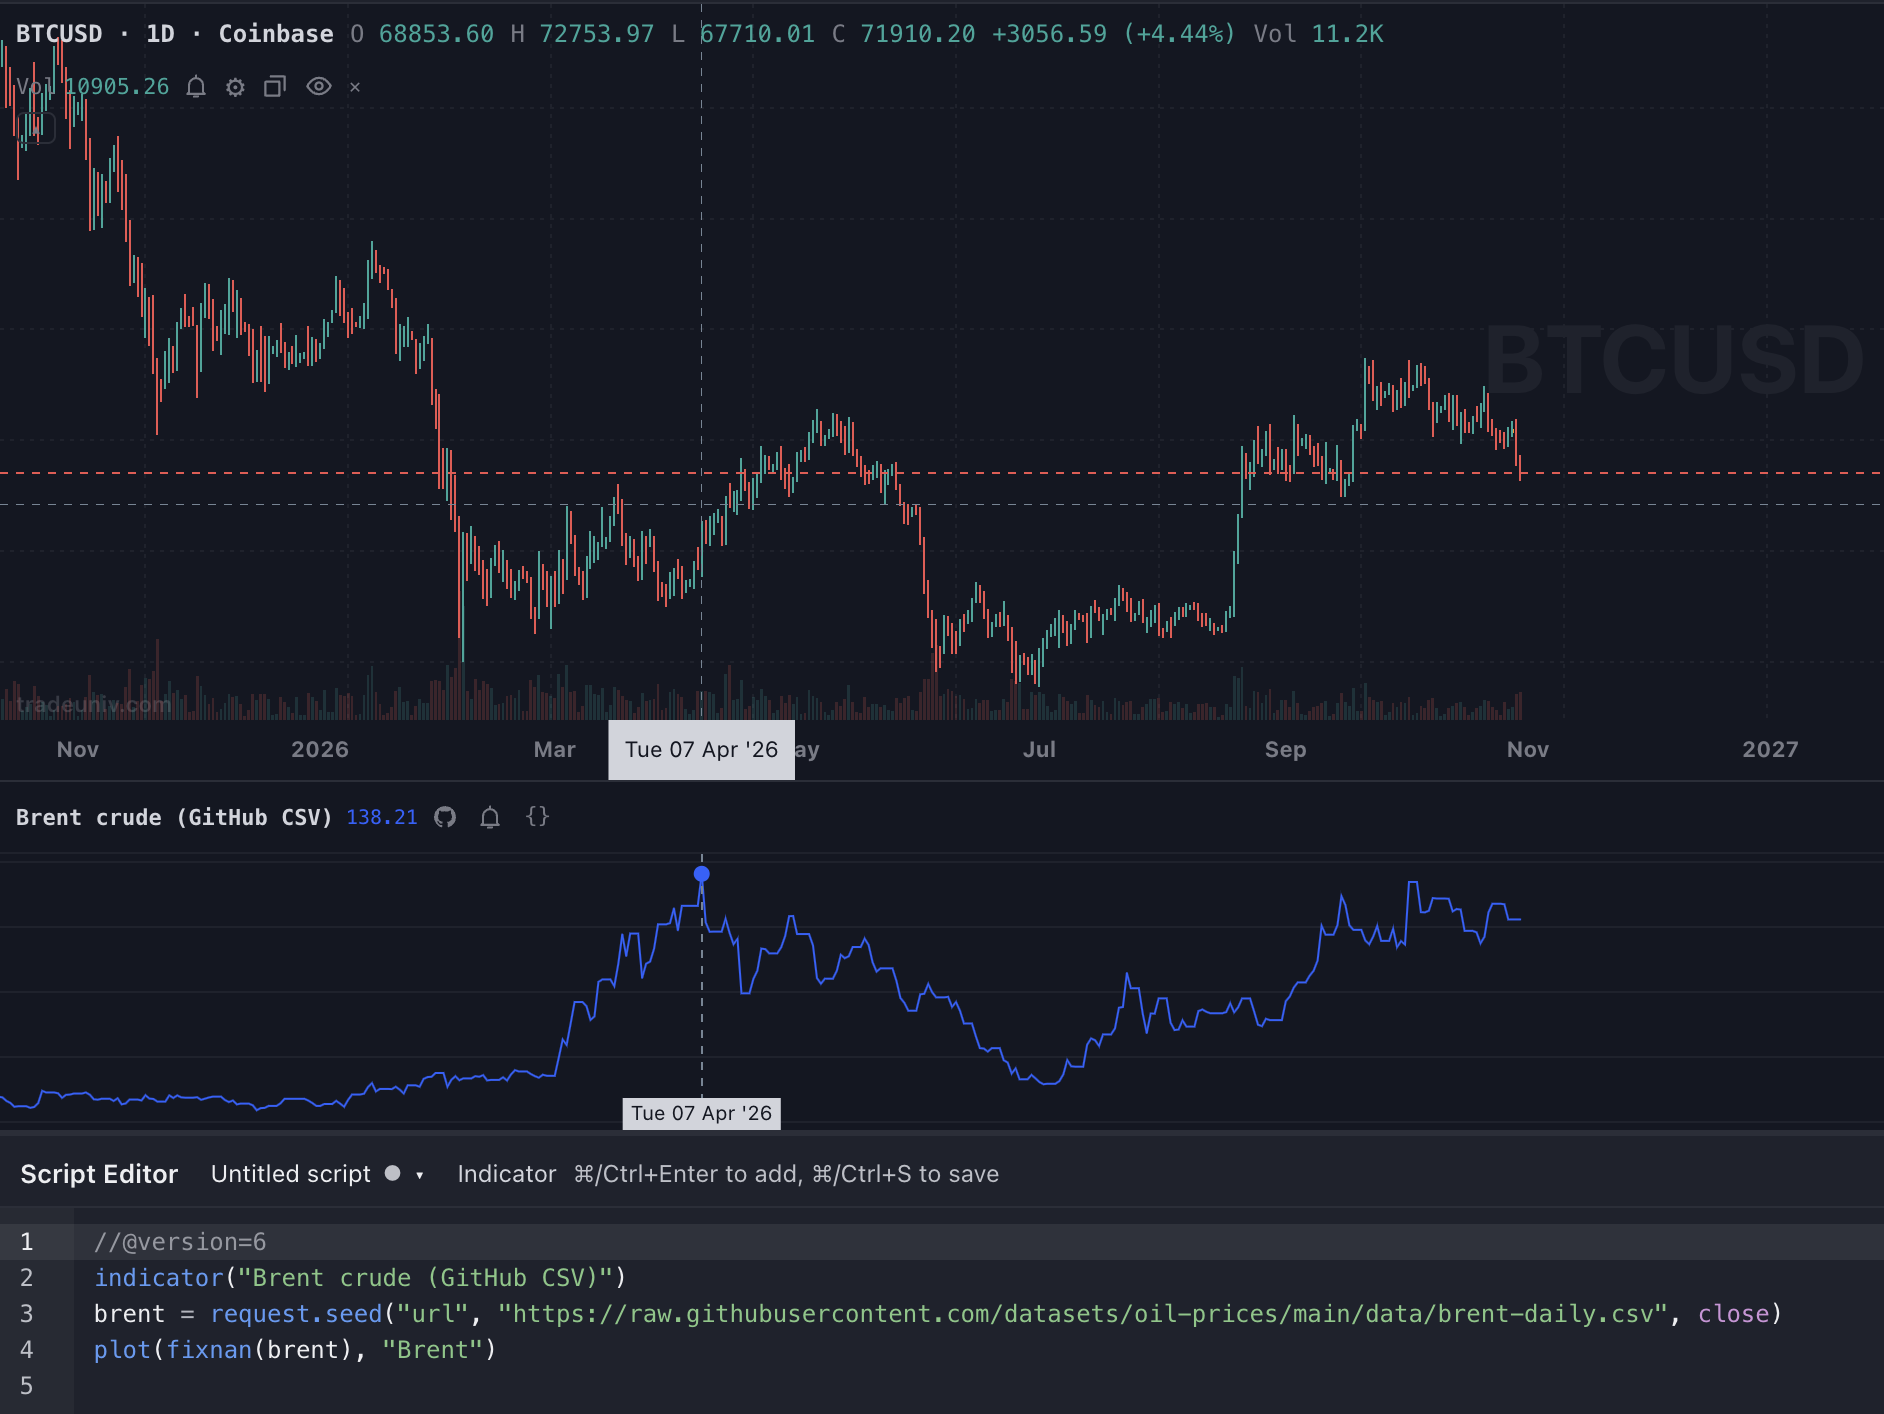
For a wider CSV with a header row, name the column you want the same way:
value: the column to read (default: the second one)time: the date column (default: the first one)rows=Column=Value: keep only the rows where a column holds that value
NASA's monthly global temperature anomaly lives in a CSV that mixes two sources in one file. Keep one of them and read its Mean column:
//@version=6
indicator("Global temperature anomaly (GitHub CSV)")
t = request.seed("url", "https://raw.githubusercontent.com/datasets/global-temp/HEAD/data/monthly.csv#rows=Source=GISTEMP&time=Year&value=Mean", close)
plot(fixnan(t), "GISTEMP °C", color.red)
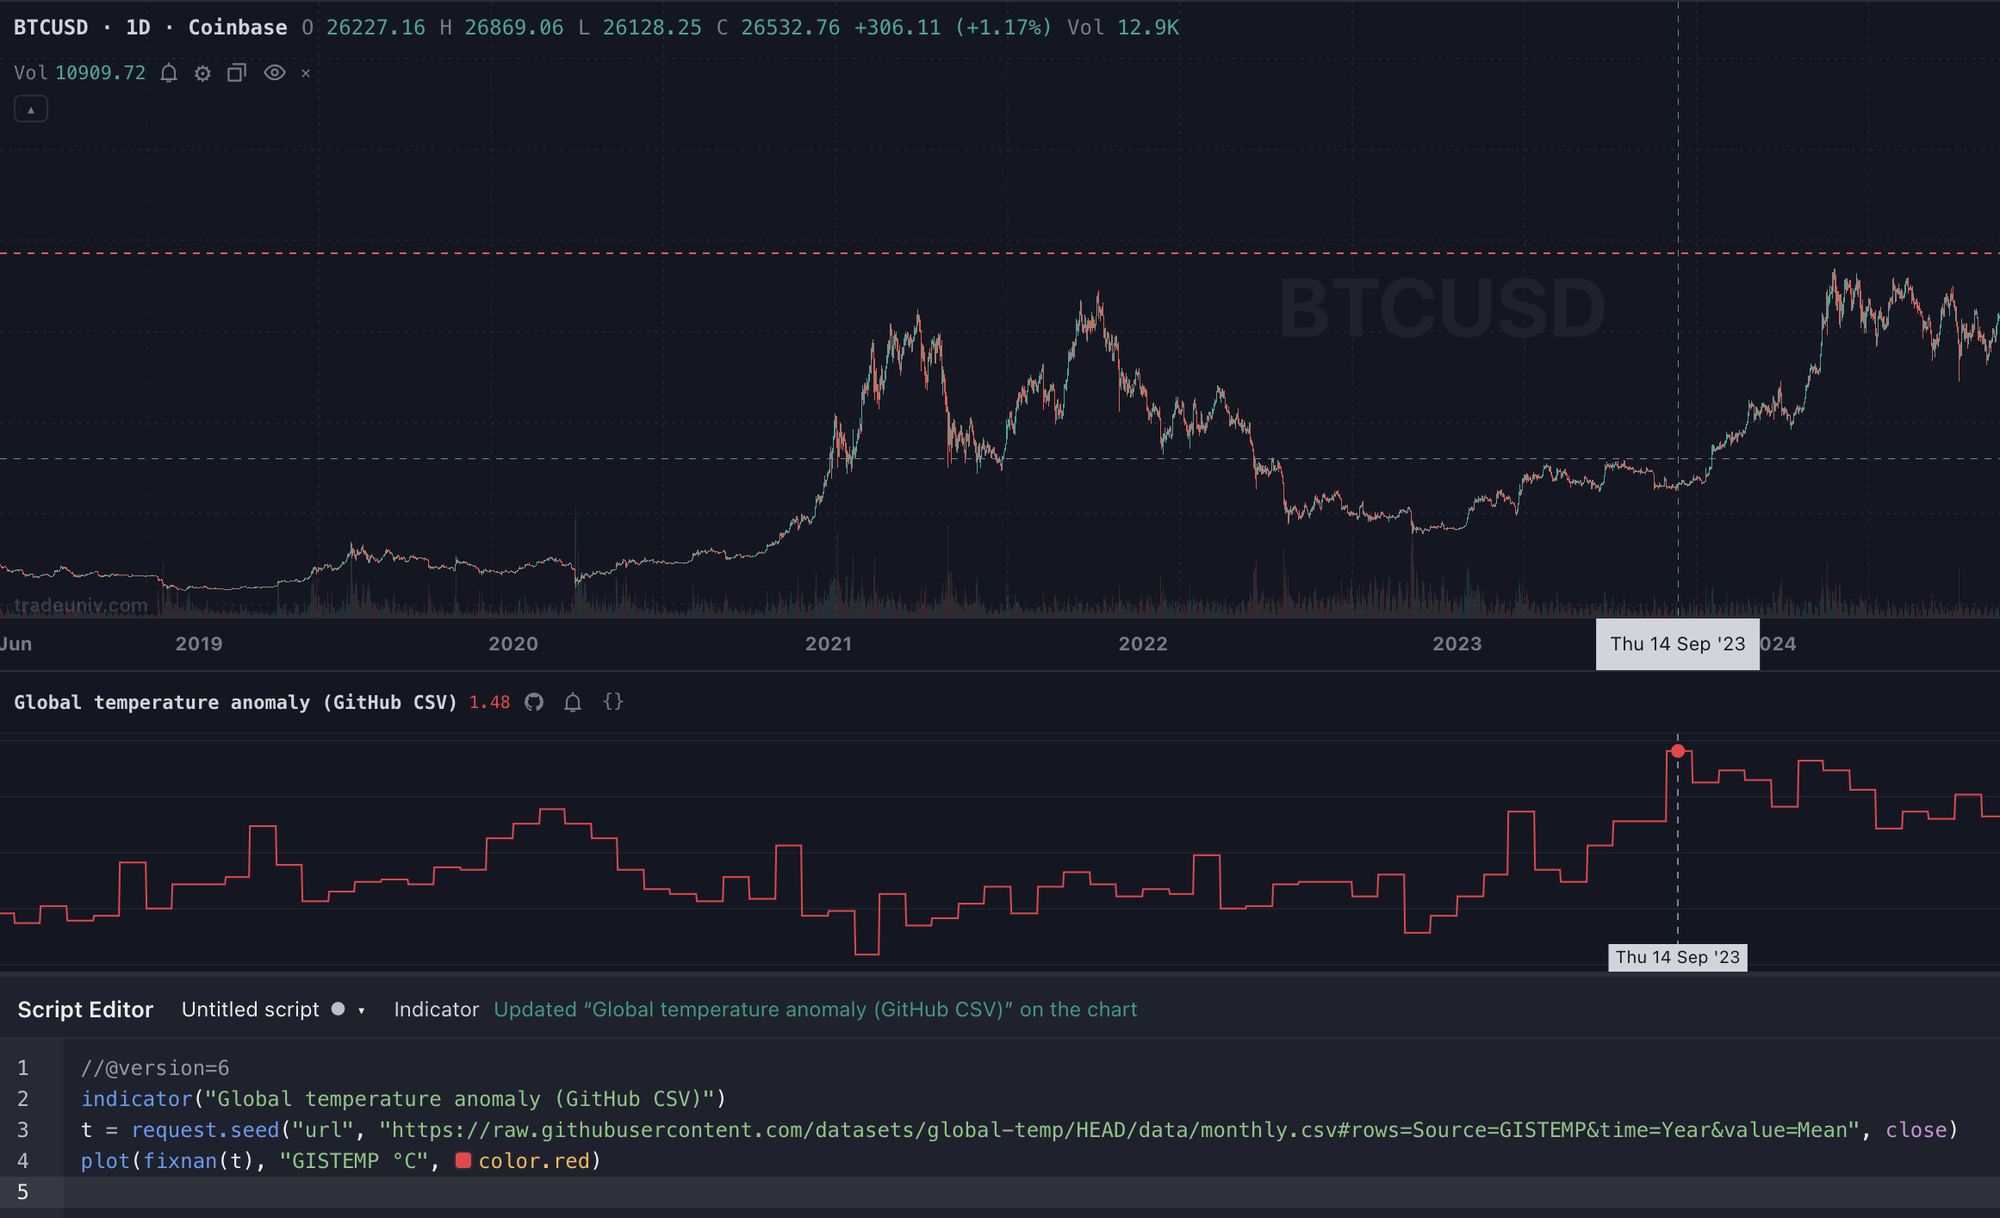
Dates can be ISO (2026-10-30), unpadded (2023-3-9), epoch seconds or milliseconds, a bare year (2026), or statistics periods like 2026-M08 and 2026-Q3.
Macro Data Without a Single URL
Some sources are built in, so you don't need to know any endpoint.
Fed funds rate vs. the target range, from the New York Fed:
//@version=6
indicator("Fed funds: effective rate vs target range")
effr = request.seed("url", "https://markets.newyorkfed.org/api/rates/unsecured/effr/last/500.json#rows=refRates&time=effectiveDate&value=percentRate", close)
lo = request.seed("url", "https://markets.newyorkfed.org/api/rates/unsecured/effr/last/500.json#rows=refRates&time=effectiveDate&value=targetRateFrom", close)
hi = request.seed("url", "https://markets.newyorkfed.org/api/rates/unsecured/effr/last/500.json#rows=refRates&time=effectiveDate&value=targetRateTo", close)
pLo = plot(fixnan(lo), "Target low", color.gray)
pHi = plot(fixnan(hi), "Target high", color.gray)
fill(pLo, pHi, color.new(color.gray, 85))
plot(fixnan(effr), "EFFR", color.orange, 2)
COT positioning, straight from the CFTC report, for the futures you trade:
//@version=6
indicator("COT: NQ speculators vs commercials")
// Net non-commercial (speculator) position, and commercials, 10 years of history
specs = request.seed("cot", "NQ", close)
hedgers = request.seed("cot", "NQ:comm_net:10y", close)
plot(fixnan(specs), "Speculators", color.orange, 2)
plot(fixnan(hedgers), "Commercials", color.teal, 2)
hline(0)
US CPI from the BLS, using the JSON options to join the year and month fields into a date:
//@version=6
indicator("US CPI (BLS)")
cpi = request.seed("url", "https://api.bls.gov/publicAPI/v1/timeseries/data/CUUR0000SA0#rows=Results.series.0.data&time=year,period&value=value", close)
plot(fixnan(cpi), "CPI", color.red, 2)
Any DBnomics series, by its full id:
//@version=6
indicator("ECB deposit rate (DBnomics)")
ecbRate = request.seed("dbnomics", "ECB/FM/D.U2.EUR.4F.KR.DFR.LEV", close)
plot(fixnan(ecbRate), "ECB deposit rate", color.blue, 2)
How It Behaves on the Chart
It's daily. Each day carries the value in effect that day, so a monthly or weekly series shows up as a step line on daily and higher charts. On intraday charts, wrap the call in fixnan() so every bar holds the latest value.
It's fetched once. The first run downloads the file. Changing the timeframe, scrolling, new bars and re-runs all read the saved copy. URL data refreshes every 6 hours; COT data refreshes after each Friday release. Changed your file and want it now? Add ?v=2 to the URL, before the #.
It doesn't touch your keys. Data loads in the browser of whoever runs the script. There's nothing to configure and no API key to leak in a shared script.
Ideas Worth Building
- Your own nightly signal. Run your model anywhere, commit the result as a CSV to a GitHub repo, and plot it under price on every chart.
- Positioning overlays. COT net positioning against price, with a 3-year COT index computed in Pine.
- Rate regime filters. Only take long setups while the Fed funds rate is falling, straight from the New York Fed.
- Custom breadth or sentiment. Any number you can put in a JSON file becomes a series you can backtest against.
Try It
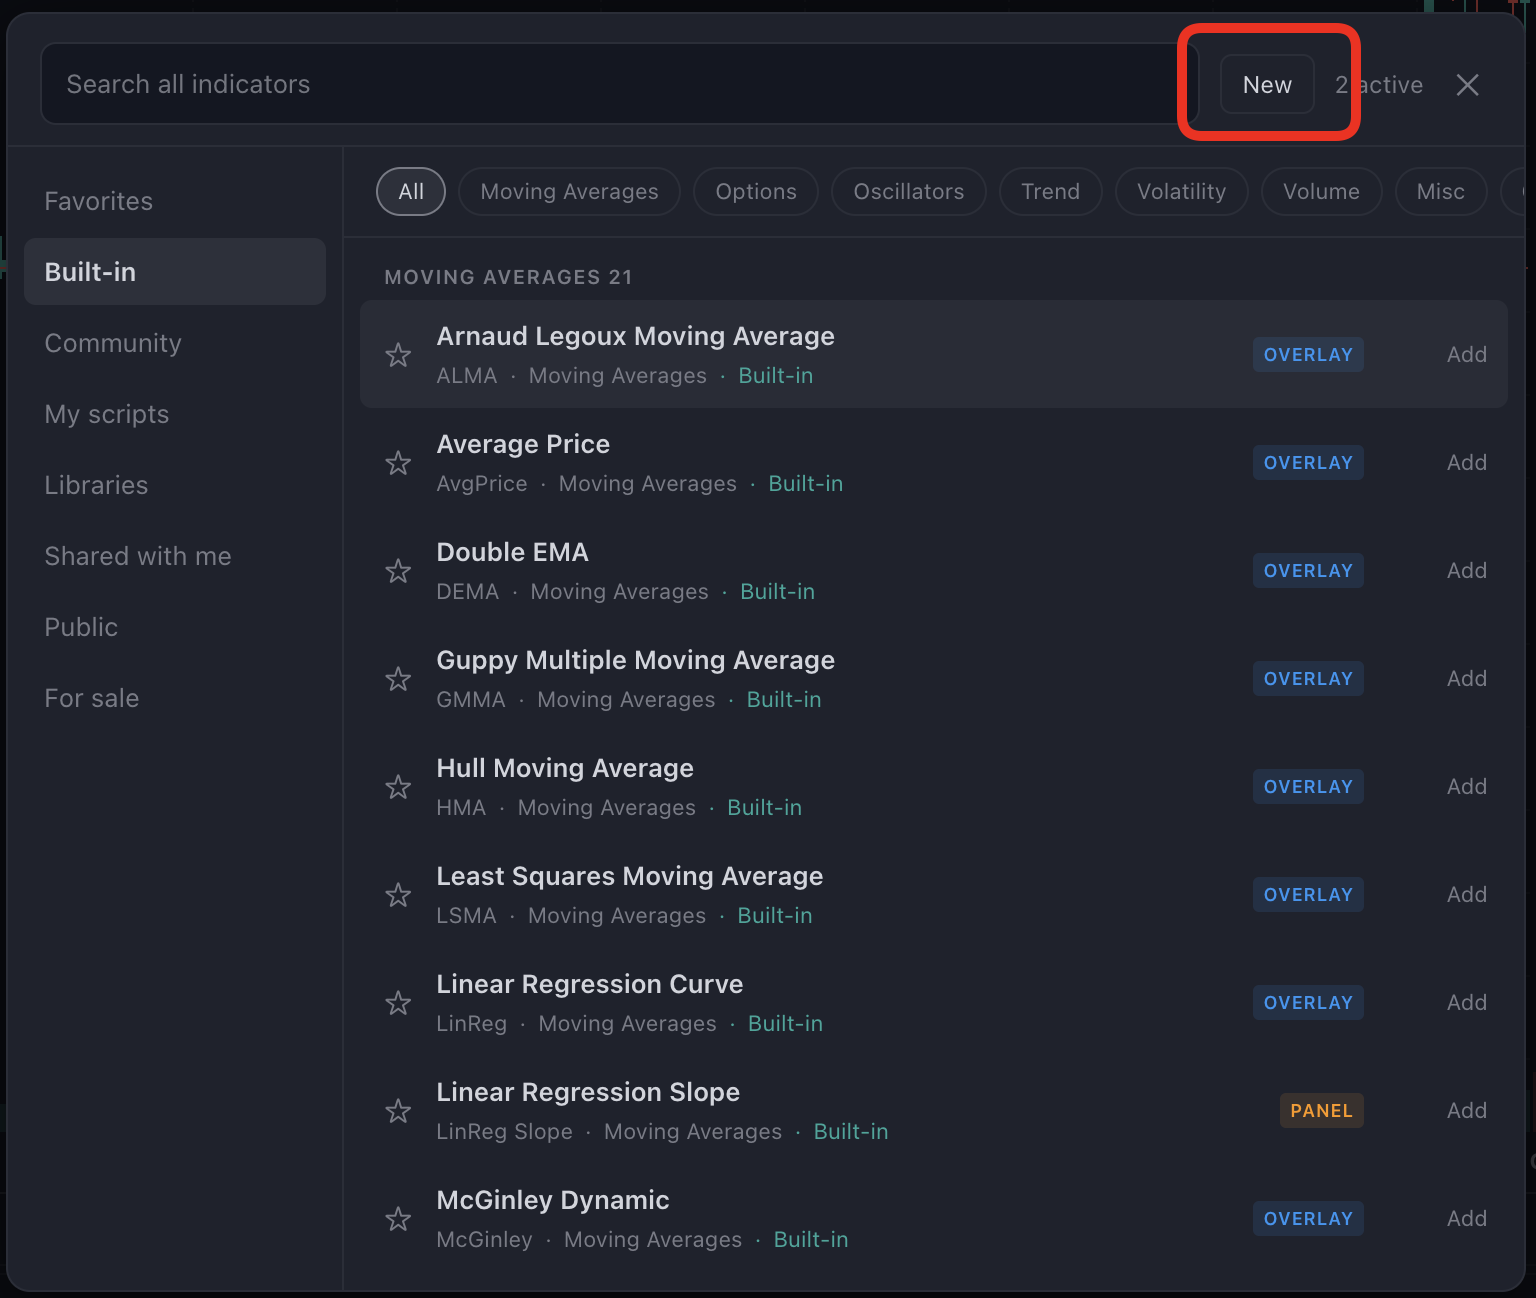
Open the chart, open the Indicators dialog and press New. Paste one of the scripts above into the Script Editor and add it to the chart. Then swap in your own file.
Want your own data on the chart? Open a TradeUniv chart and write your first request.seed script in the Script Editor.