Community scripts
Indicators, strategies and reusable Pine libraries built by traders on TradeUniv. Add a script to your chart or copy a library import.
19 scripts

Boom° is a free, open-source TradingView indicator built on the ICT x CRT concepts C1 → C2 → C3 sequence. It projects HTF candles beside your chart, marks the sweep and the C2, checks it with an LTF CISD, grades it, and tracks your C3 entry. Two versions: Boom° (with SMT + PSP) Boom° (No SMT) - https://www.tradeuniv.com/chart/scripts/tMctlQ6P-boom-ns Core logic • A candle that sweeps the previous candle's high/low and closes back inside is a forming C2 • Confirmed only with its LTF CISD • Newest confirmed C2 replaces the old one • Dies if C3–C5 takes its protected extreme Sequence modes • Boom: 1m chart → 1H model (5m CISD), other charts below 4H → 4H model (15m CISD), plus C3 entry lanes • Classic: follows the Fractal pairing (1m-15m … 1D-1M, Auto, Custom), CISD on the Fractal LTF, no lanes Sequence Table • BIAS, LIVE CANDLE (C3/C4/C5/WAITING C2) • C2 QUALITY: CISD 75 (required), inside 75% of C1 +5, POI/SMT-fill +10, SMT +5, POI+SMT +5 → LOW / HIGH / BOOM / INVALID • POI: nearest unfilled FVG on the bias side • C3 SETUP lanes and EXECUTION (Boom) HTF panels • Up to 3 auto HTF panels with C1–C4 labels, sweeps, FVGs, SMT and C2+PSP • ✦ marks the model panel • Panel C-Labels: Live or Confirmed • Green ● on confirmed C2s still standing On chart: sweeps, CISD/IC-CISD, entry zones, EQ, SD projections, day open, PDH/PDL, PWH/PWL, PMH/PML, SMT engine, SMT-fill. Alerts: C2 closed + LTF CISD; C3 sweep and C3 entry (Boom only). Good to know • The table is the source of truth • Boom works on 1m–3H charts • Above 1H: no lanes, grade uses CISD + SMT only • C3 lanes need 1m data; the C2 check works in replay • Not signals, the decision is yours
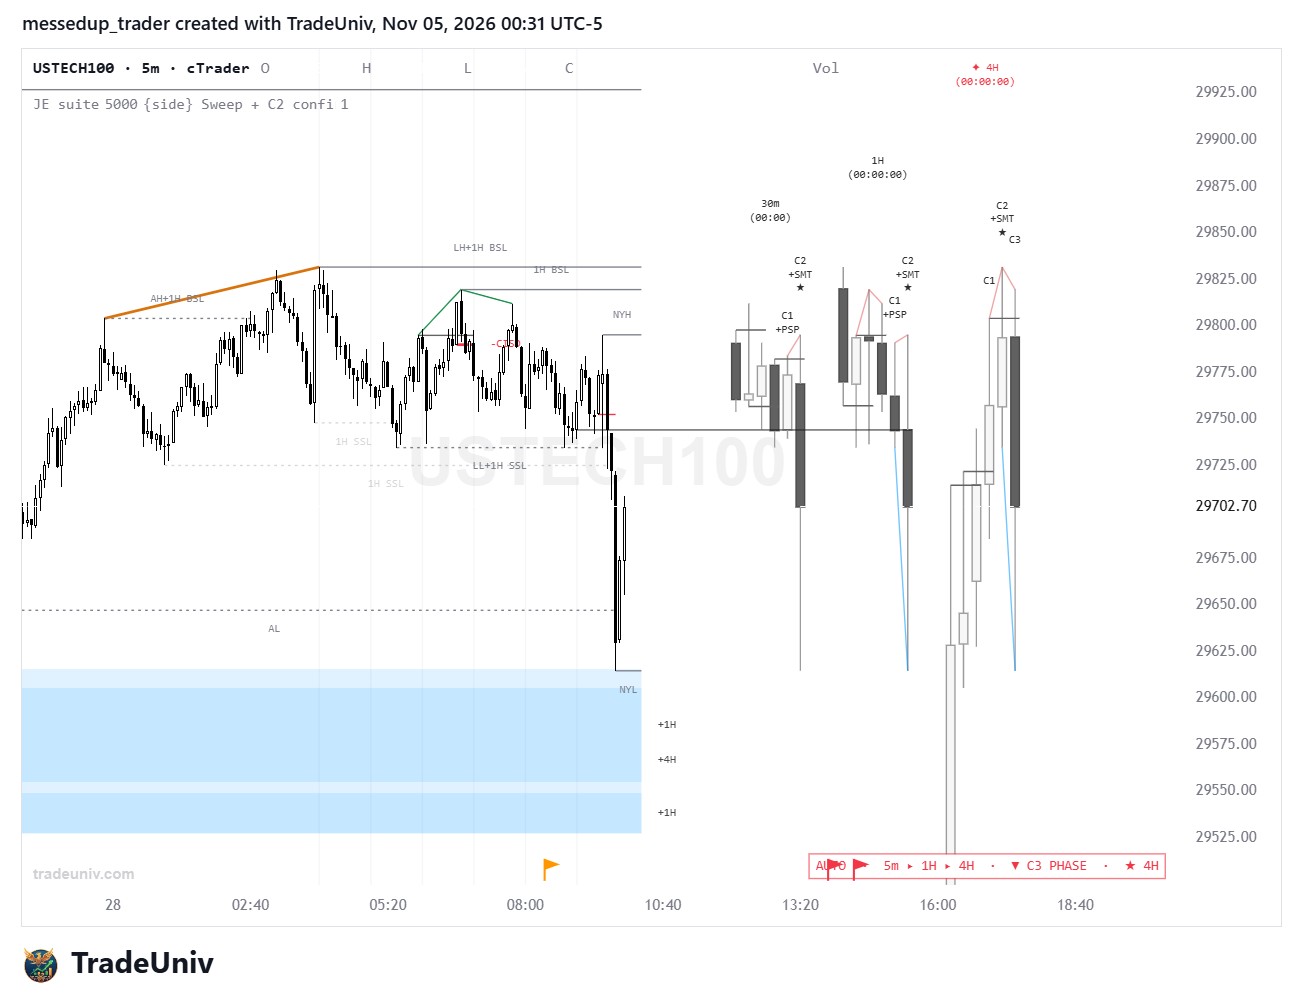
Does everything. Everything you need. HTF candles c2 cisd sessions HTF fvg TF alignment profiling BSL/SSL

Goldbach AMD+GBT draws time-based phase boxes for: Main phases (A, M, D1, D2) 14:00 to 14:00 according to Hopiplaka's writings on ict's logo 1st fractal phases 2nd fractal phases This indicator follows Hopiplaka’s research on the ICT logo geometry and its application to market timing. The core idea is to track where price is inside the active phase and monitor reactions near the midpoint of manipulation segments (main or fractals), or in case of time distortion: at the end, sometimes beginning of D phase. The middle of D1+D2 is a fractal manipulation phase, most of the times in that zone occur reversals or retracements. Mid-lines can be enabled independently for each phase layer to support this workflow. It can be used to train the anticipation of reversals with any price system, like Base 0 Goldbach Levels or Circuit Breakers, for example. It also includes GBT Swings (Friend of Hopi Angeles’s code), with swing classification and time-number projections (Minute (black numbers) / Minus (blue numbers) / Plus(green numbers)), plus an optional ALGO reference table. Key features: Timezone-aware phase mapping Automatic boundary alignment to the active chart timeframe Separate controls for visibility, labels, transparency, border style/width, and colors Independent mid-line toggles for Main, 1st fractal, and 2nd fractal groups GBT Swings module with liquidity-based filtering Minute / Minus / Plus number detection on swing points Optional ALGO table with customizable colors and size Special thanks to Friend of Hopi Angeles for the original GB Swings code. I made additional fixes and adjustments to integrate and improve it in this script. This script is a visual time-structure tool and does not provide financial advice or guaranteed signals. Use it as part of your own analysis and risk management process. All credits to Hopiplaka and Ajay for their findings.

Goldbach Trifecta is an overlay TradeUniv indicator that maps price into Power-of-Three (PO3) dealing ranges and marks structured percentage levels inside those ranges. It is built for visual context: range highs and lows, premium vs. discount zones, liquidity, flow, and rebalance areas, plus optional trade-plan overlays and info panels. Core range engine Builds a dealing range from a selectable PO3 size (powers of three, plus a 1,000,000 option). Supports a Decimate factor so the same logic can be scaled for forex and other tick sizes. Can show multiple ranges above and below the current one. Level and layer display Within each range the script can plot high/low, mid/equilibrium, and named intra-range levels associated with: Liquidity / rejection (green group) Flow / “sweet spot” and non-Goldbach companions (blue group) Internal rebalance / internal rejection / equilibrium (red group) Fractals and mini map Fractal Fib draws the same structure between the current intra-range Goldbach band. Hide main levels can leave only the fractal overlay. Optional fractal mid-levels. Mini Map draws a compact copy of the structure to the right, with manual or session attach (London / New York), X position, bar width, and auto-scroll. Tables, markers, and chrome Info table: PO3, decimate, auto flag, ticker/timeframe, active layer or plan. Optional layer table naming the current zone (liquidity / flow / rebalance / dead zone) and range bounds.

This indicator is created under the guidance and teachings of Hopiplaka. It aims to plot Dynamic Ranges based on the teachings of Hopiplaka, as outlined in his Twin Tower book which aims to expose and explain the ICT. The user can configure the following settings. Settlement Window The user can input the respective asset settlement time window. The script will take the opening price of the respective candle. IMPORTANT NOTE - Please ensure that the time window you entered is also visible on the chart or supported by that timeframe. Say if you entered 14:03 and you are plotting it on A 4H chart, the indicator will not plot as you cannot see 14:03 candle on A H4 chart. Parameters As explained in Twin Tower book - please refer CME website for the respective asset you are viewing Circuit Breaker %ge to use. Or you can enter any %ge of your choice too. Level Type As explained in Twin Tower book of Hopiplaka, you can toggle between IMP Nodes and Goldbach Levels. In Hopiplaka we trust!

Boom° (No SMT) is the lighter version of Boom° Same C1 → C2 → C3 sequence, Boom / Classic modes, Sequence Table, HTF panels, confirmed C2 dot and alerts, without the SMT engine, SMT-fill and PSP. C2 QUALITY scoring here: CISD in C2 75 (required), C2 inside 75% of C1 +5, POI +20 LOW 75%–80% HIGH 95% BOOM 100% Use this if you trade a single asset or want a lighter script. If you want SMT and PSP, the full version, Boom°, is also published publicly. Boom° (SMT version) - https://www.tradeuniv.com/chart/scripts/Zyjx8Ose-boom

T1M3//CYCL3S.exe [ALU³] is a time-based market structure tool, It shows you when the key trading windows start and end, and how price moved inside each one. Session and cycle boxes: Asia, 270, 90, 30 and 10 minute cycles are drawn as boxes that track each window’s high and low in real time. Macro windows: 30-minute windows from XX:45 to XX+1:15 are marked for the New York session. Daily dividers and day labels: each trading day is separated, so you can scan back through multiple days quickly. Optional opens: turn on the 00:00, 09:30, 10:00, 14:00 and 20:00 opening prices, plus the daily, weekly, monthly and yearly opens. Fully customizable: colors, opacity, line styles, labels and time zone can all be adjusted. It is built to be light and fast, so it won’t slow your chart down.


Circuit Breakers plots a reference price and a set of percentage bands around it, scaled to a circuit-breaker distance you choose. It is a chart overlay for studying how far price has moved from a fixed reference, not a signal generator and not an official exchange halt feed. The anchor is the close of the intraday bar that contains your fix time, in the time zone you set. The default is 15:59 in UTC-4, so the reference lines up with the last minute before 16:00 US Eastern. On each new session bar the script stores that close, adds any calibration offset, and treats the result as the fix. From that fix it builds one distance: fix × (circuit-breaker percent ÷ 100) Decimate CB divides that percent by 10 before the distance is calculated. The same distance is then marked above and below the fix. Preset percentages are 3.5, 4, 7, 10, 13, and 20. These match commonly used limit-style percentages for different asset types, including equity-index style 7 / 13 / 20 limits. The script does not download CME, exchange, or broker reference prices. It only uses the chart’s own fix, or a price you type in. Lines are drawn at the fix, at the full breaker distance (100%), at the midpoint of that distance (50%, the CE line), and at six intermediate fractions of the same distance on each side: 14%, 26%, 40%, 60%, 74%, and 86%. The intermediate fractions follow a fixed premium/discount partition of the breaker distance. Plot names tag those fractions against the 7 / 13 / 20 family and an internal importance label.


How to use it Fast cloud (8/21): Helps identify short-term momentum. Slow cloud (21/34): Helps assess the broader trend and potential dynamic support/resistance. Conviction EMAs (13/48): An upward triangle appears when the fast EMA crosses above the slow EMA; a downward triangle appears when it crosses below. Time Warp: Lets you calculate the ribbon using another timeframe, such as 15 minutes, 1 hour, 4 hours, or daily. Candle Bias: Optionally colors candles based on their relationship to the selected bias EMA. Important: This version uses lookaheadoff, so higher-timeframe EMA values can change while the higher-timeframe candle is still forming. That can cause signals to change before the candle closes. The candle-bias calculation also compares the chart's close to the selected-timeframe EMA, matching the original design. If you want to use this for your ES/NQ intraday trading, I can also make a non-repainting version that confirms higher-timeframe signals only after candle close.
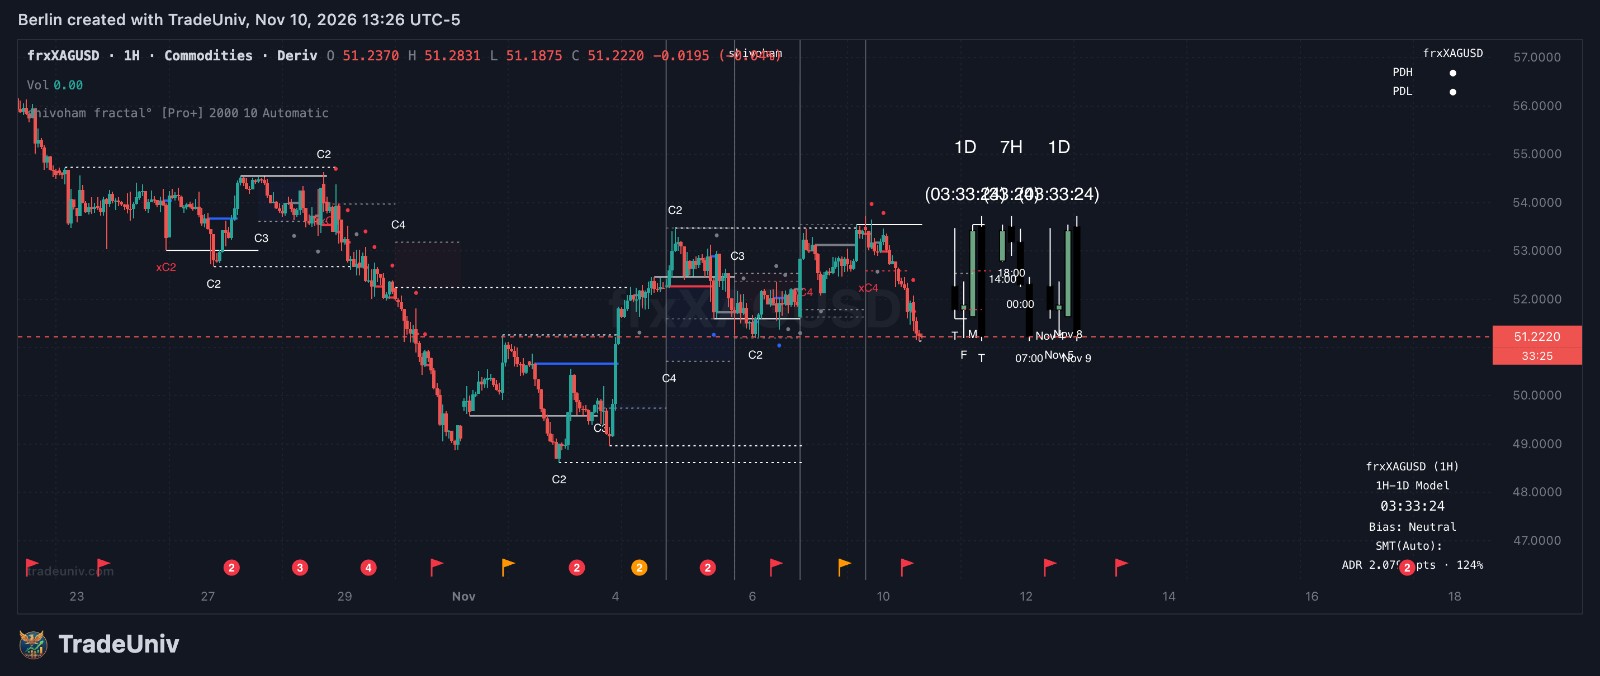
shivhoham fractal model indicator, the latest version of fractal indicator. im lazy to type more


Key Levels Center — Sessions & True Opens A customizable overlay combining higher-timeframe levels, session ranges, opening ranges, pivots, and Quarterly Theory True Opens. Key Levels Includes opens, previous highs/lows, midpoints, and closes across 1H, 4H, daily, weekly, monthly, quarterly, and yearly periods. Also features Monday’s range and daily/weekly floor-trader pivots. Sessions Asia develops from 09:00 Tokyo until London opens. London develops from 08:00 London until the selected New York opening. Choose 08:00 New York for forex or 09:30 for US stocks. Ranges freeze when their window ends and reset at their next opening. London and New York follow DST automatically. Optional session ORBs and a forex opening range from 17:00 New York are included. True Opens True Opens reference Q2’s opening price within each cycle: • MiTO: 22.5-minute cycle, +5m37.5s. • 90m-TO: 90-minute cycle, +22m30s. • STO: Rolls at 19:30, 01:30, 07:30, and 13:30. • TDO: Midnight. • WTO: Monday, 18:00. • MTO: Second Monday, 18:00. • YTO: First Monday of April, 18:00. All True Open times use New York local time with automatic EST/EDT adjustment. Each level remains until its next corresponding Q2 replaces it. Customization Adjust visibility, colors, line styles, labels, historical levels, and nearby-level merging. Notes Calculations use chart candles. Smaller timeframes offer finer timing. A marks a sample taken after its anchor. Short cycles and long-term levels depend on chart timeframe and available history. Use standard candles. Reference levels do not guarantee trading outcomes. Credits Credit and appreciation to SpacemanBTC.

NDOG + NWOG PRO v6.1 | Kenobi75 An indicator based on ICT (Inner Circle Trader) concepts developed by Michael J. Huddleston. Automatically identifies and displays New Day Opening Gaps (NDOG) and New Week Opening Gaps (NWOG). What it shows: NDOG: Price gaps between the previous trading day's close and the new trading day's open. NWOG: Price gaps between Friday's close and Sunday's opening. High and Low boundaries of each gap. Optional 50% midpoint (Consequent Encroachment). Historical daily and weekly opening gaps. Labels displaying dates and days of the week. How to use it: NDOG and NWOG are important reference levels in ICT methodology. Traders can observe how price reacts to gap boundaries and their 50% midpoint. These levels may act as potential support, resistance, or price reaction zones. They can also be used alongside liquidity analysis, market structure, and Fair Value Gaps (FVG). Customizable settings: Show or hide NDOG and NWOG independently. Adjust the number of historical gaps. Customize line colors, thickness, and visibility. Enable or disable the 50% midpoint. Adjust line extensions and label settings. Highlight previous weekly gaps. Credits: Original ICT concepts: Michael J. Huddleston (Inner Circle Trader). Indicator development: Kenobi75. Programming assistance: OpenAI. Independent indicator inspired by ICT methodology. Not officially affiliated with or endorsed by ICT. For educational and technical analysis purposes only.

Extended Macros – Kenobi75 v2.1 ICT Time-Based Macros | New York Time Extended Macros – Kenobi75 is a customizable indicator designed for futures traders, particularly Nasdaq (NQ) and S&P 500 (ES). It displays colored horizontal segments in a separate panel, highlighting time windows commonly used in ICT-style market analysis. Key Features 10 customizable time windows based on New York time (America/NewYork). Individual color settings for each window. Editable start times in HH:MM format. Adjustable window duration from 1 to 120 minutes. Live preview of active time windows. Adjustable line thickness and transparency. Individual enable/disable controls for each window. Historical display settings. Timeframe filters: 15s, 30s, 1m, 3m, 5m, 15m. Automatic daylight saving time adjustment. Reversal / Continuation Coloring Optional automatic coloring compares price movement within each window to the preceding impulse. 🟣 Reversal: Price moves against the previous impulse. 🟠 Continuation: Price movement does not meet the reversal condition. This is a custom mathematical classification, not an official ICT trading model. When automatic coloring is disabled, each window uses its individually selected color. Live Preview During an active window, a temporary segment appears and extends as time progresses. Its final color is assigned after the window closes. Recommended Timeframes 15-second and 1-minute charts provide the most accurate window detection. Intended Use Designed to support ICT-style analysis alongside liquidity, market structure, and Fair Value Gaps (FVG). The indicator does not generate buy or sell signals and should not be used as a standalone trading strategy. Author: Kenobi75 & OpenAIA Developed in Pine Script v6 for TradingV


ICT Open Range Gap & 1st FVG (fadi) An ICT-inspired trading indicator designed for analyzing Nasdaq futures (NQ) using opening gaps, fair value gaps, session liquidity levels, and institutional trading concepts. Main Features: 1. Opening Range Gap (ORG) Identifies the gap between the previous Regular Trading Hours (RTH) close and the current RTH opening price. Highlights the opening gap as an important reference area. Helps traders observe price reactions around the opening gap. 2. First Fair Value Gap (1st FVG) Identifies the first qualifying Fair Value Gap after the 9:30 AM New York opening. Supports configurable minimum FVG size to filter out insignificant gaps. Highlights bullish and bearish imbalances for intraday analysis. 3. Session Liquidity Levels Asia High and Asia Low. London High and London Low. Previous Day High (PDH) and Previous Day Low (PDL). Previous Month High (PMH) and Previous Month Low (PML). Previous Week High (PWH) and Previous Week Low (PWL). RTH High and RTH Low. Midnight Open and other configured opening reference levels. 4. Daily and Weekly Opening Gaps New Day Opening Gap (NDOG). New Week Opening Gap (NWOG). Important reference zones based on opening price differences. 5. Chart Customization Configurable visibility of individual levels and zones. Adjustable display settings, colors, and visual presentation. Designed to support ICT-based intraday market analysis. Purpose This indicator combines important ICT reference levels into one chart, helping traders analyze liquidity, price imbalances, opening gaps, and potential areas of market reaction. It is intended for discretionary analysis and does not automatically generate trading signals. Disclaimer: For educational and analytical purposes only. Not financial advice.
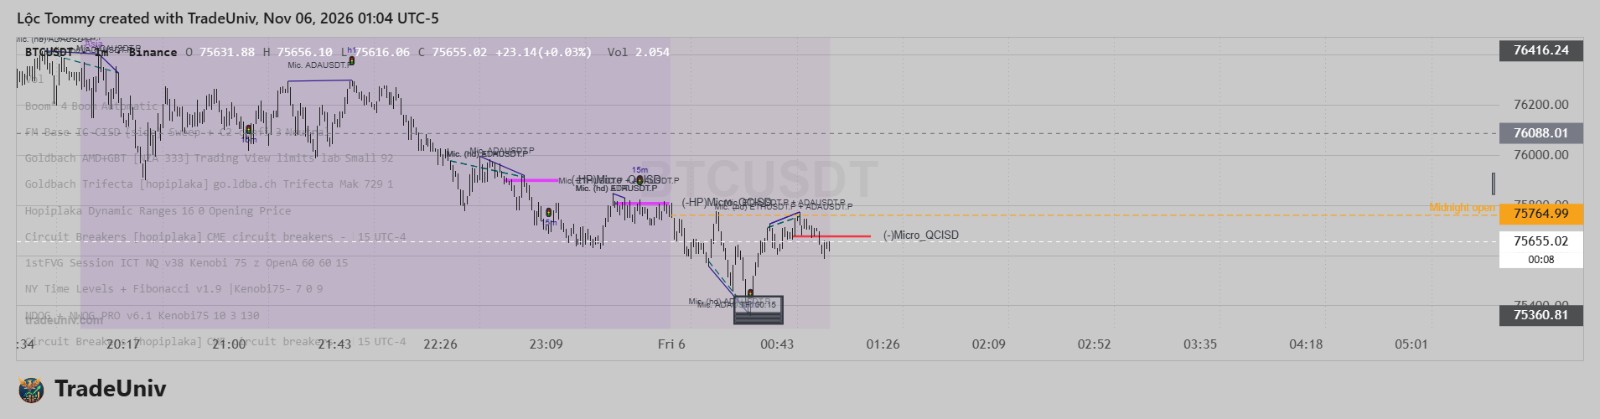
Library "Drawingspublic" : Functions to manage drawings on the chart extendline(lineId, labelId) : Extend specific line with its label Parameters: lineId labelId updatelinecoordinates(lineId, labelId, x1, y1, x2, y2) : Update specific line coordinates with its label Parameters: lineId labelId x1 y1 x2 y2 updatelabelcoordinates(labelId, value) : Update coordinates of a label Parameters: labelId value deleteline(lineId, labelId) : Delete specific line with its label Parameters: lineId labelId updateboxcoordinates(boxId, labelId, left, top, right, bottom) : Update specific box coordinates with its label Parameters: boxId labelId left top right bottom deletebox(boxId, labelId) : Delete specific box with its label Parameters: boxId labelId
import u_b703775b6f06c476/LudoGH68_Drawings_public_1/1 as lib